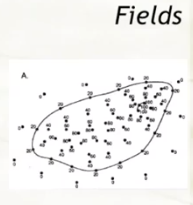
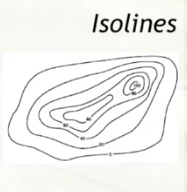
Fields are points of Data. When equal points are connected, you have an isoline.
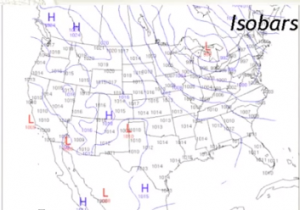
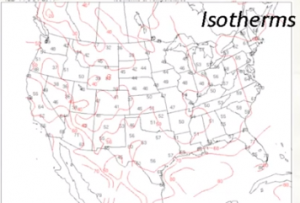
Isolines may be called isobars, isotherms or contour lines. It depends on what data are represented. If you were to follow one of these lines around the mountain, you would not increase of decrease in elevation.
Isobars
Isotherms
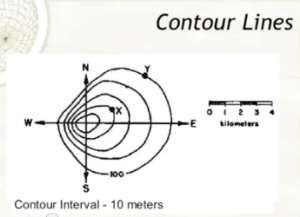
Contour Lines
7 Rules of Contour Lines
1. Countour lines never cross
2. Contour lines never touch
3. Contour lines indicate areas of equal elevation
4. Contour lines show a steep slope, far apart countours show a gentle slope.
5. Index llines are darker and show elevation
6. Vs point upstream
7. Hachures denote depression
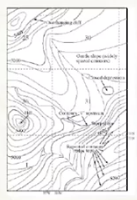
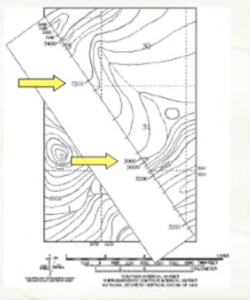
Our Topographic map
We have a topographic map. We are looking at the landform from a bird’s eye view.
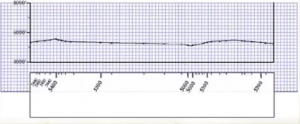
A Profile
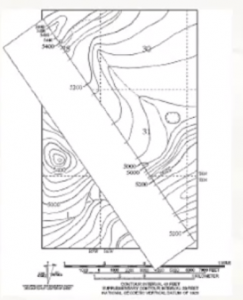
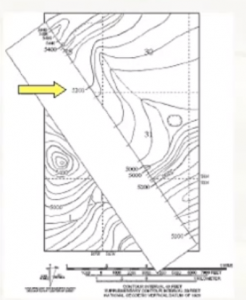
How do we really know what the cross section looks like? We can do this by taking a scrap paper across the area we wish to investigate. After that, we extend the contour lines onto the scrap paper.
Mark the index contour lines.
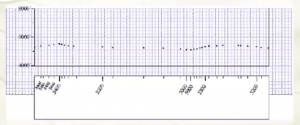
Points of Data
Below are the points listed from the lines on the scrap to the graph paper according to elevation.
A profile is made when the point are connected.

